

Despite a 12 cents per gallon gas tax passed by the S.C. legislature in 2017, S.C. leads the nation in bad roads based on a May 2021 report from Zutobi.
The S.C. gas tax costs residents billions of dollars at the pump. Why are our roads still ranked the worst in America?
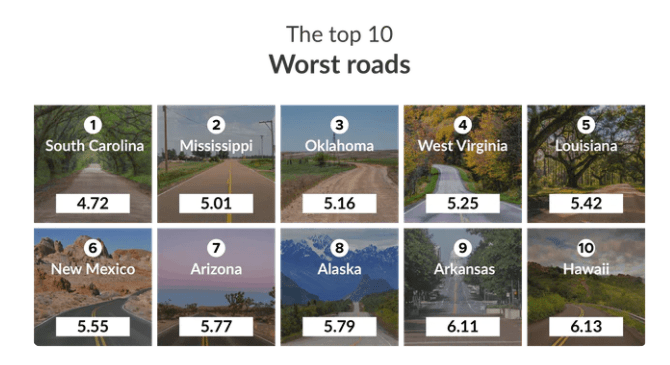
1. South Carolina. Score: 4.72 / 10
Coming in at the very bottom with the worst roads in the country is South Carolina. It’s the only state to be scored below 50% on just 4.72, and it has the highest highway fatality rate of 1.83.
2. Mississippi. Score: 5.01 / 10
The next entry, just making it above a score of 5, is Mississippi. Over 20,000 miles of public roads in Mississippi did not meet an acceptable standard, contributing to its low score.
3. Oklahoma. Score: 5.16 / 10
Oklahoma’s low score is due to it having one of the highest levels of unacceptable quality roads in the country, with less than two-thirds being rated acceptable to drive on.
4. West Virginia. Score: 5.25 / 10
The Mountain State claims 4th place with a score of 5.25, which is indicative of the poor standard of roads.
5. Louisiana. Score: 5.42 / 10
Having recorded 768 highway fatalities in 2018, Louisiana’s fatality rate is higher than most at 1.53. This has greatly contributed to its low overall score.
6. New Mexico. Score: 5.55 / 10
Of the 77,605 miles of public road in New Mexico, over 30% is rated unacceptable, earning it 6th place.
7. Arizona. Score: 5.77 / 10
Arizona’s roads are actually in pretty good shape considering its harsh desert environment, but the 1,010 highway deaths recorded in 2018 bring its overall score down to 5.77.
8. Alaska. Score: 5.79 / 10
Alaska is the most northerly state in the US, and also the most sparsely populated. The often tricky terrain and icy conditions make accidents more likely and roads more difficult to maintain.
9. Arkansas. Score: 6.11 / 10
The people of Arkansas drive 26.6 miles per day on average, which is almost 10 miles less than the US average. This low score won’t encourage them to change that.
10. Hawaii. Score: 6.13 / 10
The final entry in our 10 states with the worst roads is Hawaii. The Aloha State has the smallest public road network in the country, totaling only 4475 miles in length. However barely half of this network is considered of acceptable quality, with 43.6% requiring improvement.
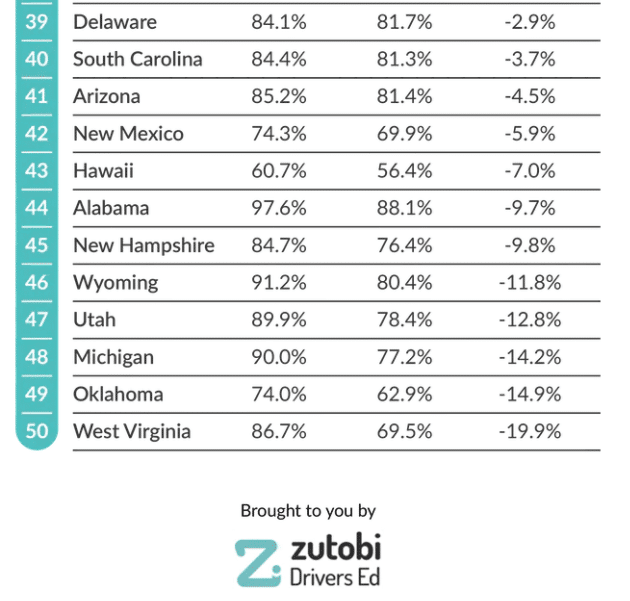
NOT ONLY THIS, BUT SINCE 2015, SC RANKS 40th IN IMPROVED ROAD QUALITY.
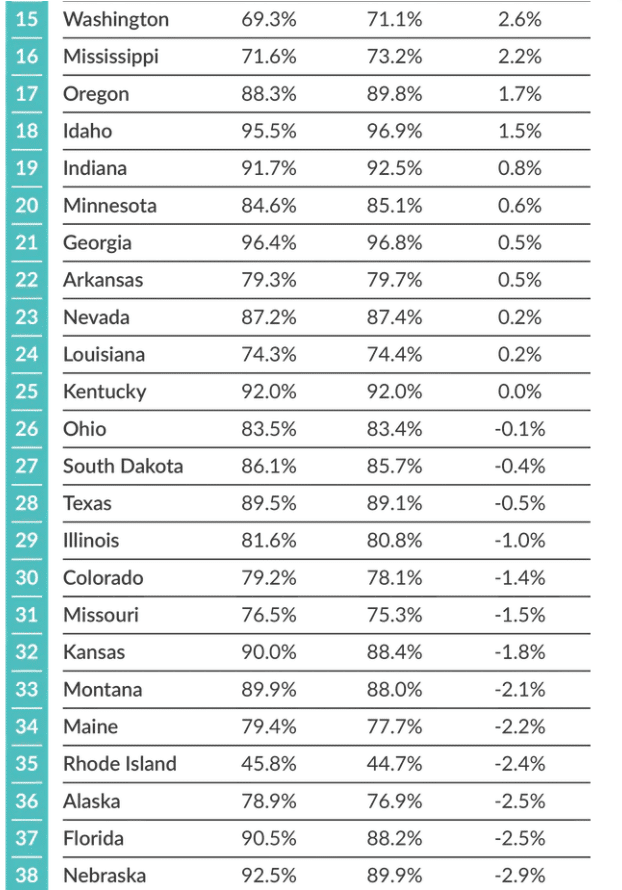
Report shows S.C. has a negative 3.7% change in road quality since 2015.
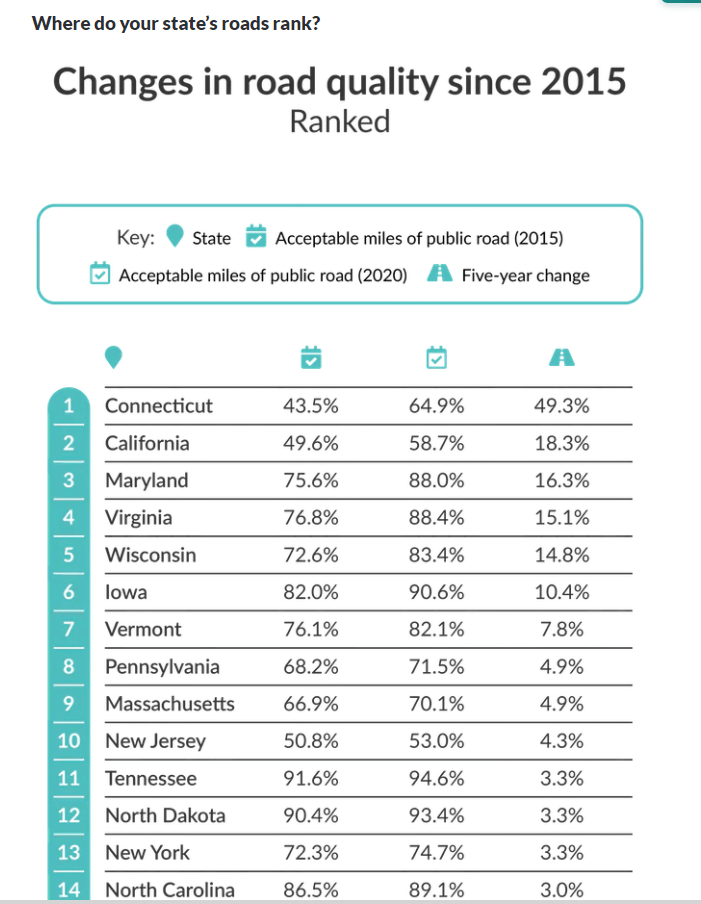
Most (and Least) Improved Roads Since 2015
Connecticut has experienced by far the biggest increase in road surface quality since 2015, with a 49.3% increase in the proportion of its roads rated acceptable or higher. The next most-improved is California with an increase of 18.3%.
In contrast, West Virginia’s roads are deteriorating at the quickest rate, with a 19.9% decrease in the number of acceptable quality roads over the last five years.
The public road network in the United States is almost 4.2 million miles long and continues to grow.
While the quality of roads in each state varies dramatically the overall trend is positive, with the total miles of acceptable roads increasing by 4.3% since 2015.
Methodology
To determine which states had the worst roads, Zutobi used data from the United States Bureau of Transportation Statistics website. This data showed us the total miles of roads in each state, and how much of it was deemed acceptable according to the International Roughness Index.
The most recent data available on road surface quality was recorded in 2020 and was used to indicate current levels. We compared this data with records from 2015 to get a view of the changes over the last 5 years.
We also considered additional factors such as the rate of highway deaths to calculate an overall score for the roads in each state.
Sources:
- Bts.gov – Road Condition Data 2020 & Other Metrics
- Bts.gov – Road Condition Data 2000 & 2015
- Worldhighways.com – The Importance of Road Maintenance
- Worldhighways.com – Bad Roads Make People Poorer
- Roadsafetyfacts.eu – What Role Do Road Users And Infrastructure Play In Improving Safety
- Pothole.info – Do Rough Roads Hurt Fuel Efficiency
- Statista.com – US States by Population Density