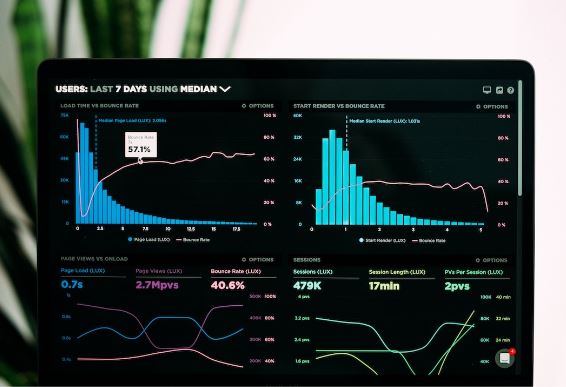
It’s remarkable how the combination of vertical or horizontal rectangles can help to illustrate and understand massive data sets. When numbers and algorithms seem overwhelming, a bar chart simplifies the complication, making it everyone’s respite. This article will decipher everything you need to know about a bar chart, its aesthetic appeal, and its usefulness in various disciplines. So, whether you’re a student, a business owner, or a project manager, keep reading.
Understanding Bar Charts
So, what is a bar chart? A bar chart is a visual representation of data that uses rectangular bars to depict the quantity or frequency of different categories or variables. Also known as a bar graph, it is one of the most common and easily understood types of charts used in data visualization.
Typically, a bar chart is divided into two axes – the x-axis and the y-axis. The x-axis represents the categories or variables being compared, while the y-axis represents the scale of measurement or values associated with each category. The bars in the chart are proportional in length or height to the values they represent, making it easy to compare and interpret the data at a glance.
Bar charts are especially useful data visualization tools for comparing and presenting categorical data in a visually appealing manner. They can be used to show trends over time, compare different groups or categories, or display any data that can be measured or counted. The simplicity and clarity of bar charts make them popular in various fields, including market research, economics, and social sciences, where data analysis and presentation are important.
The Powerful Visual Impact of a Bar Chart
One of the main reasons bar charts are so widely utilized is their visual impact. The human brain processes visuals 60,000 times quicker than text, reinforcing the fact that a bar chart is an excellent tool when it comes to data representation. By turning data into a visual, a bar chart helps viewers grasp patterns, trends, and outliers much more quickly than by looking at raw data. It ensures a smooth and straightforward interpretation of the data presented.
The color schemes used in bar charts further bolster their visual impact. Different colors or shades can be used in a single chart to differentiate among categories or to highlight particular data points. A well-chosen color scheme not only makes the chart visually appealing but also increases comprehension and retention.
In addition, the orientation of bars (vertical or horizontal) can often subtly influence the interpretation of the data. For instance, horizontal bar charts are particularly useful when the category names are long or when there are a large number of categories to be compared.
Significance of Bar Charts in Different Sectors

Regardless of the domain, be it research, finance, sales, or marketing, bar charts serve diverse purposes and allow for easier data-driven decisions. Marketing professionals frequently use them in performance reports to compare marketing channels or to track sales and revenue over time. Stock analysts employ bar charts to display periods of time and compare prices, while researchers use them to compare elements over multiple categories.
In finance, bar charts aid in understanding complex datasets and trends in a simplified way. One can easily compare revenues, expenses, and profitability for different quarters, fiscal years, etc. Similarly, for sales, it helps in comparing monthly sales data, annual trends, or competitors’ sales.
Even in education, teachers and students equally benefit from the visual comparison of data. It adds an extra dimension to teaching and engaging in numeracy, making the learning process much more exciting and significant.
Bar charts are an effective way to visually represent data using rectangular bars of varying lengths or heights. They provide a simple visual representation that makes it easy for readers to understand and interpret the data being presented. Bar charts remain one of the most versatile tools for presenting comparison and contrast for categories. Their simplicity, flexibility, and visual impact make them an indispensable tool across various sectors.


